Availability
Breakdowns, changeover, starving and blocking consume planned run time.
Industry 4.0 · Internship case study
A practical path from disconnected shop-floor signals to faster loss detection, traceability and predictive manufacturing.
Problem
Production, quality, downtime, material and maintenance signals can exist without a shared loss hierarchy, trusted KPI logic or timely decision route. A dashboard can look polished while still disagreeing with the line.
“How might one defensible event model turn disconnected signals into owned, time-critical action?”
Breakdowns, changeover, starving and blocking consume planned run time.
Micro-stops, speed loss and cycle variation erode the ideal rate.
NOK, scrap, rework and retest can be counted without common context.
WIP, waiting and bottlenecks appear when clocks, states and identifiers disagree.
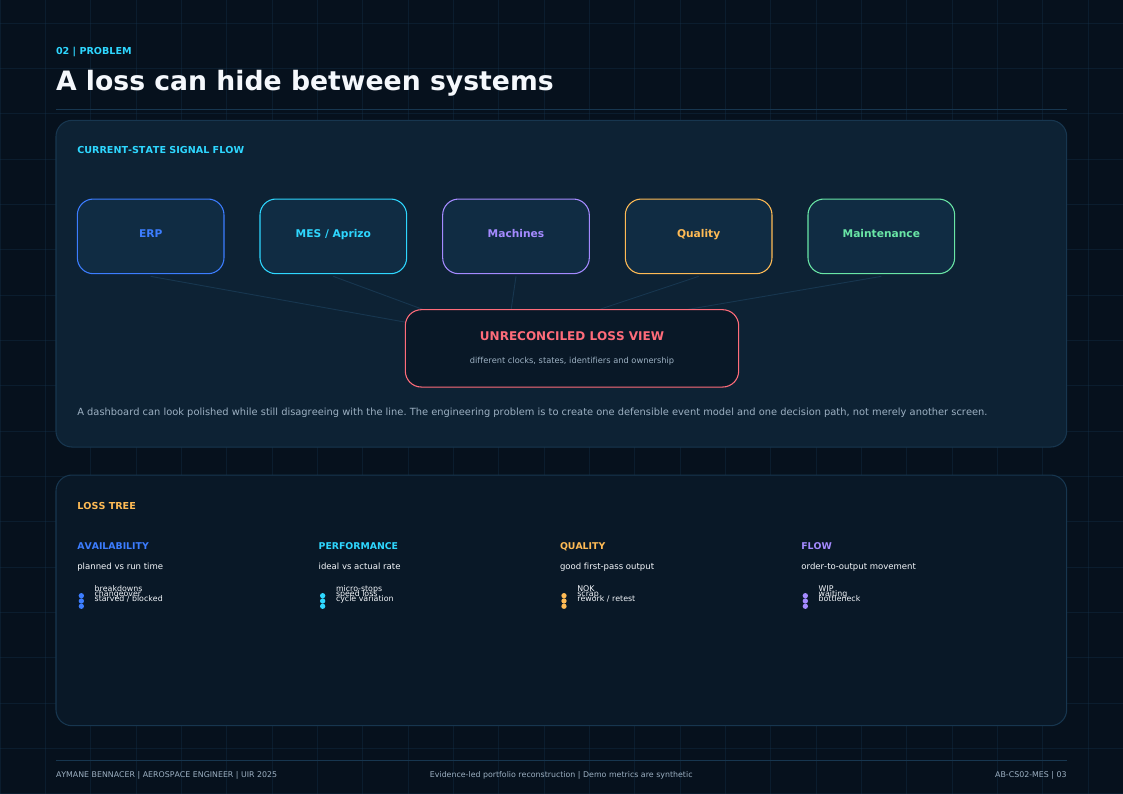
ERP, MES, machine, quality and maintenance signals before reconciliation.
Process
The sequence is deliberate: preserve raw events, transform visibly, version business rules and make every KPI point traceable to its lineage before introducing automation or prediction.
Stage 01
Map ERP, MES, machines, quality and maintenance into one loss tree.
Stage 02
Align clocks, states, IDs, output totals and scheduled windows.
Stage 03
Stratify downtime, bottlenecks, recurring NOK and traceability exceptions.
Stage 04
Build role views, drill-down, alert rules and a genealogy path.
Stage 05
Test one line and one countermeasure with a named owner and stop criteria.
Stage 06
Handover KPI rules, review cadences and a validated predictive backlog.
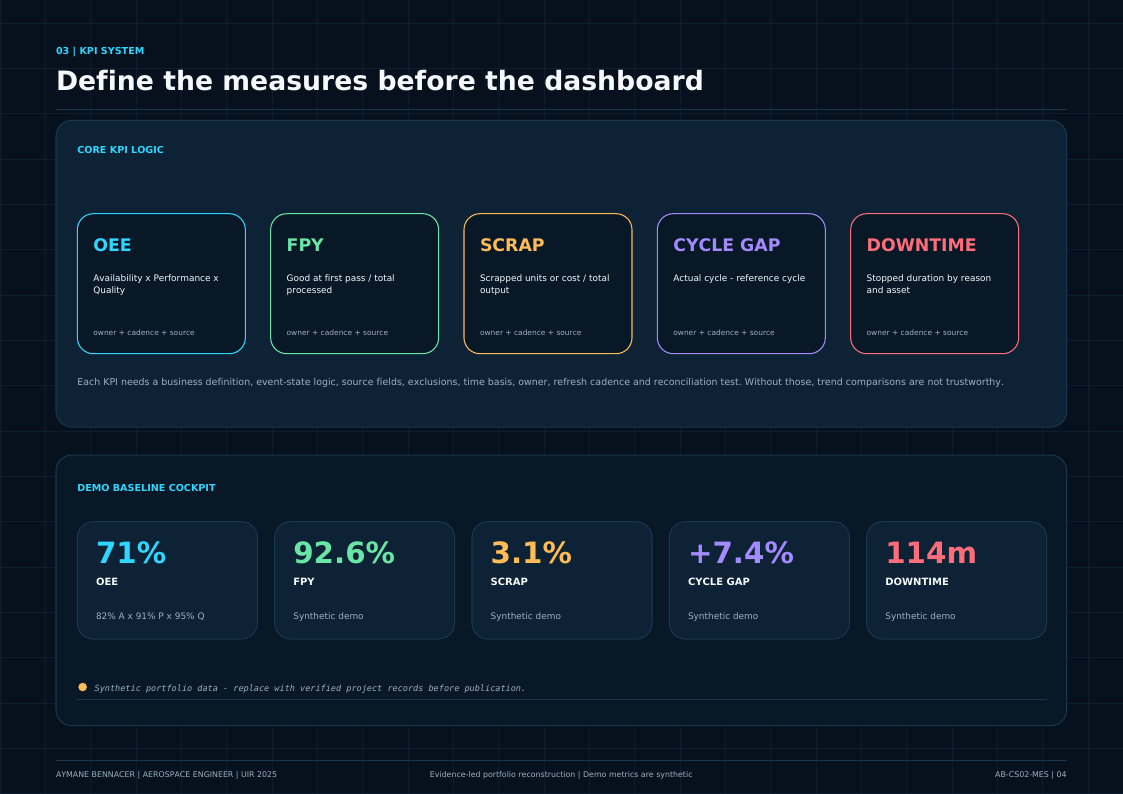
OEE, FPY, scrap, cycle gap and downtime defined before visualization.
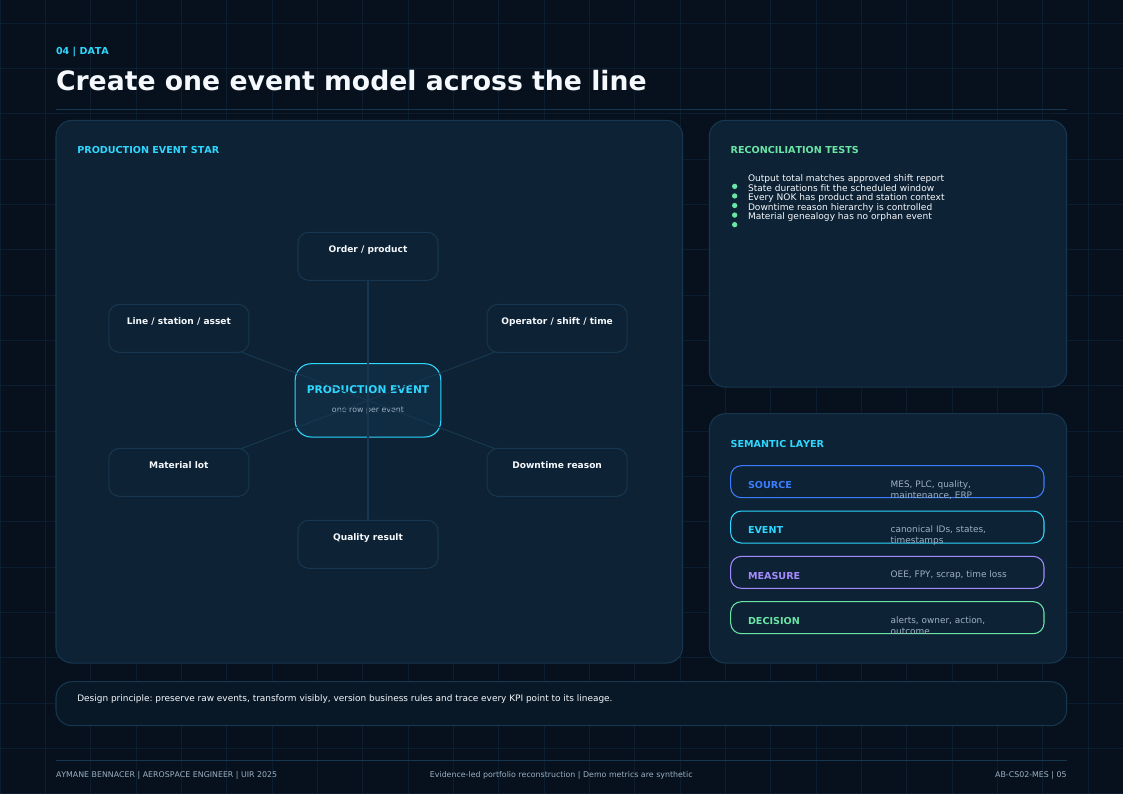
Canonical events and visible transformation from source to decision.
Solution
A governed semantic model makes OEE, FPY, scrap, cycle gap and downtime comparable. Role-based views connect the headline metric to the station, product, event, source record and accountable response.
Each measure has a business definition, event-state logic, exclusions, source, owner, cadence and reconciliation test.
A production star links order, product, station, asset, material lot, quality result and downtime reason.
Supplier lot → receipt → kitting → station events → test → finished unit → shipment.
Descriptive, diagnostic, predictive and prescriptive maturity only advance when the prior evidence gate is passed.
LIVE PORTFOLIO MODEL
Synthetic portfolio data—replace with verified project records before public use.
Measurement plan · targets, not results
The pilot aims to improve operations without hiding variance, changing test rules or creating false predictive confidence. Targets remain hypotheses until verified on approved data.
Evidence
The web story keeps the document’s words, engineering logic and visual evidence—then lets the reader move through them at their own speed.
 Open visual
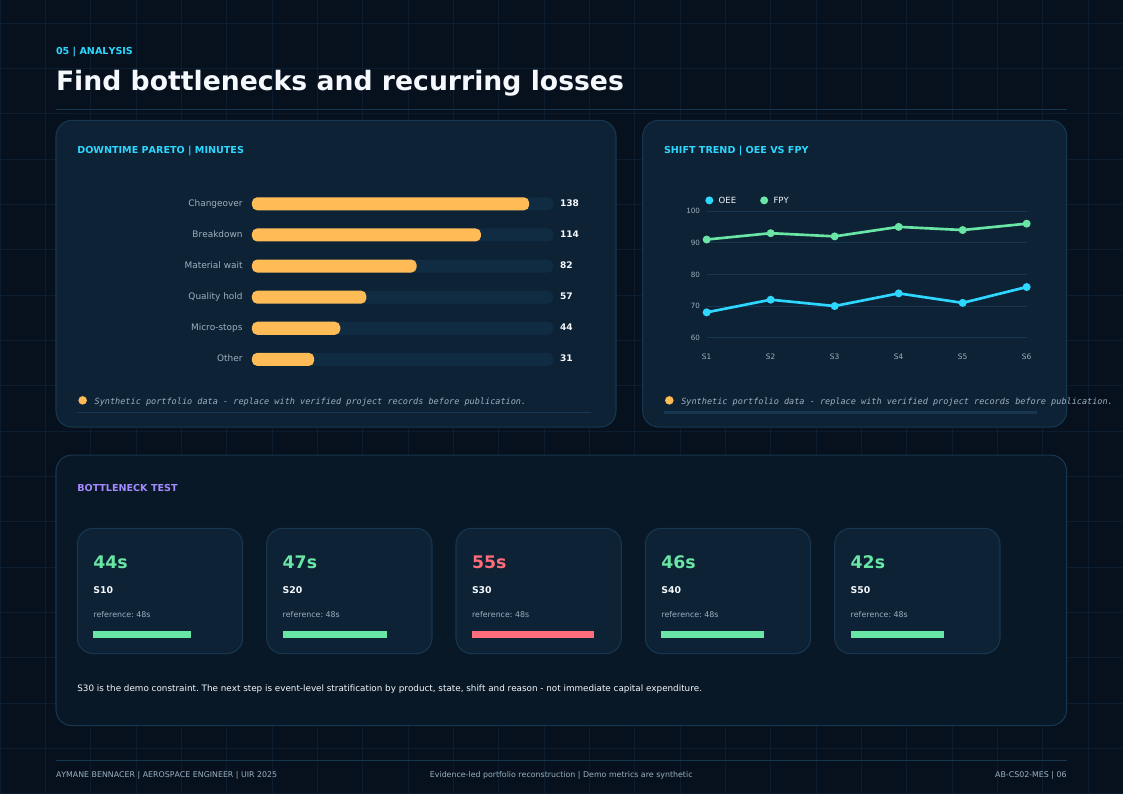
Downtime Pareto and shift trend using illustrative values.
 Open visual
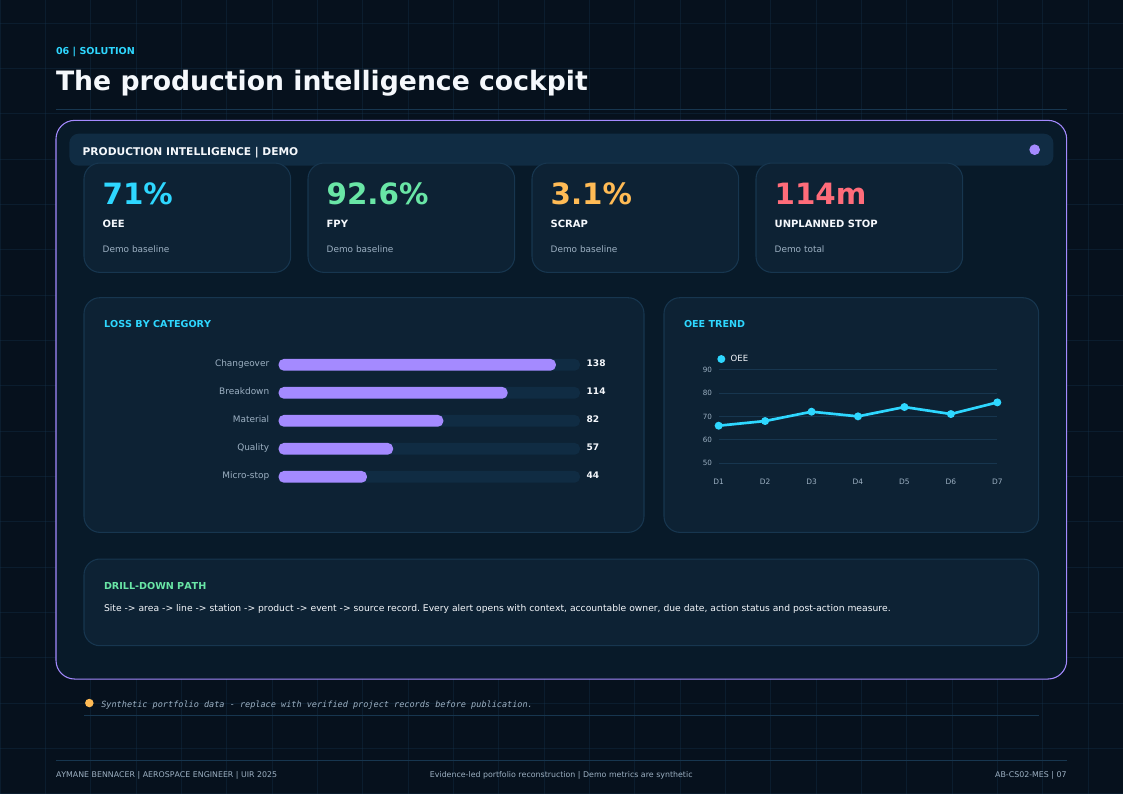
A drill-down path from site to source record and action.
 Open visual
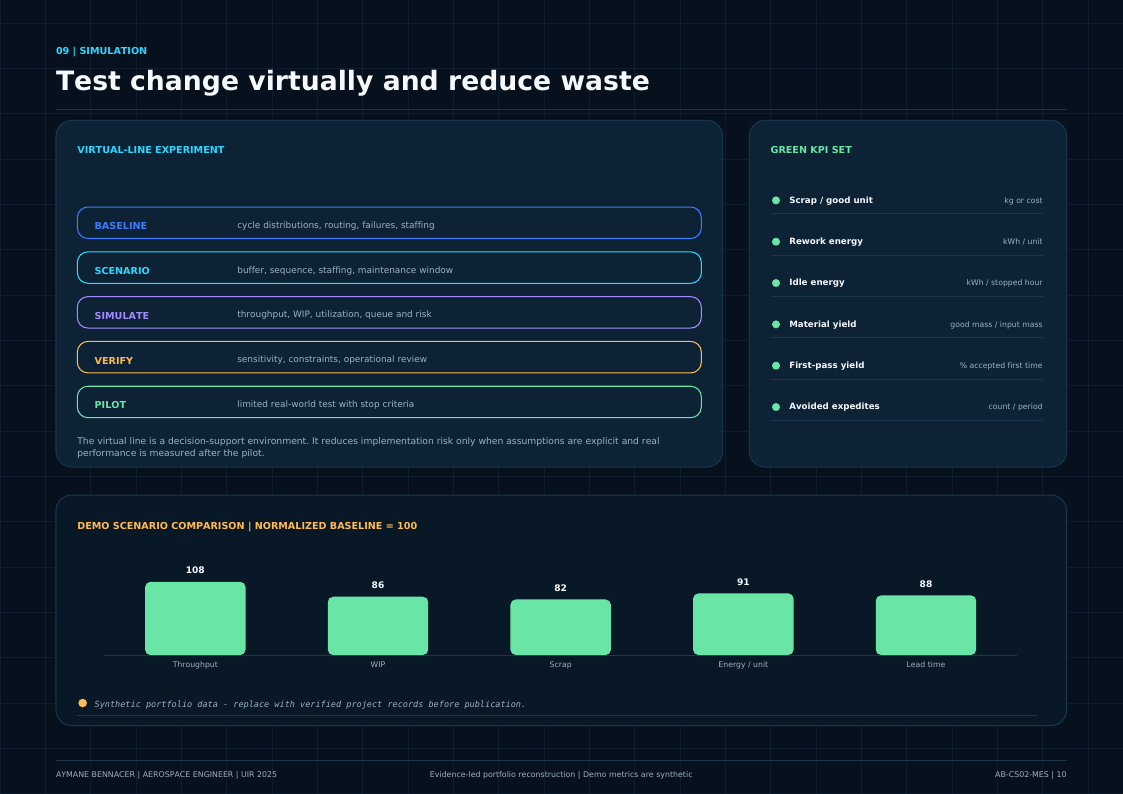
Scenario testing and green KPIs before a controlled physical pilot.
Supplied source captures
The supplied notes name Aptiv Kenitra and ‘Aprizo’. The official Dassault Systèmes product is Apriso; the exact platform name must be confirmed. All charts and targets are illustrative.